Overview
Additional options can be added to Dashboards by applying Page Actions. A Page Action pop-up will appear on a Dashboard when a user clicks a Data Point or outside the Chart panel, depending on the Page Action configuration. The Page Action configuration and the type of Chart will dictate which additional options appear on the Page Action pop-up.
User Account Requirements
The user account you use to log into Resolver must have Administrator permission or Data Management advanced permissions to set a dashboard page action.
Related Information/Setup
Please refer to the Embedding a Dashboard in an Activity article for further information regarding embedding a Dashboard in an Activity and the Dashboard Widget.
Navigation
- From the Home screen, click the Administration icon.
![]()
Administration Icon
- From the Administrator Settings menu, click the Admin Overview link.
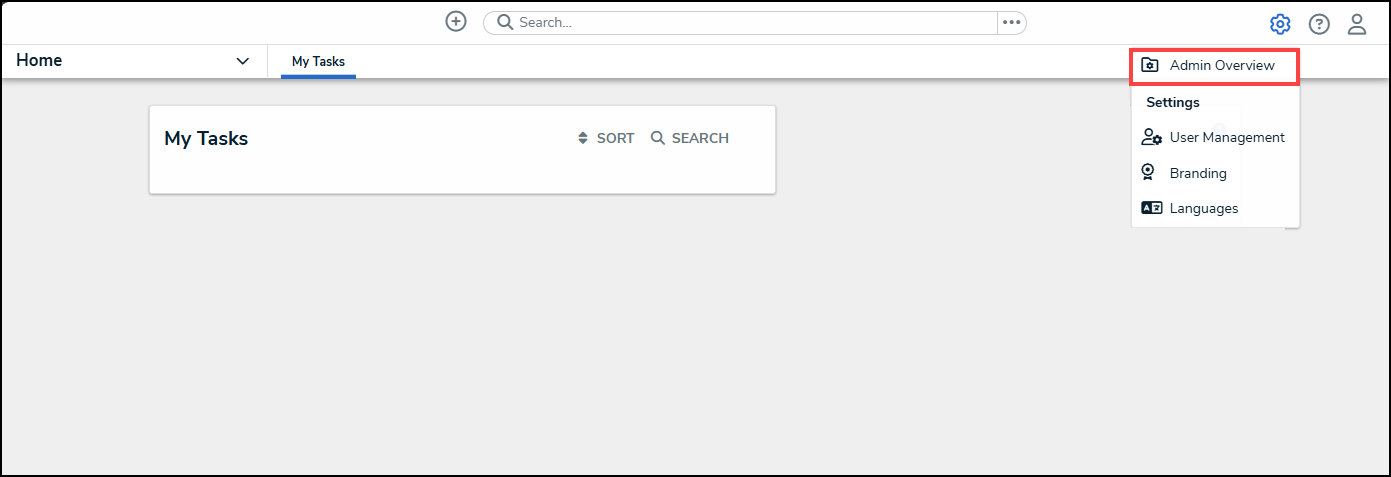
Administrator Settings Menu
- From the Admin Overview screen, click on the Dashboard Builder tile under the Views section.

Dashboard Builder Tile
- From the Dashboard Builder screen, clicking on a Chart will activate the Page Action option under the Data Panel.
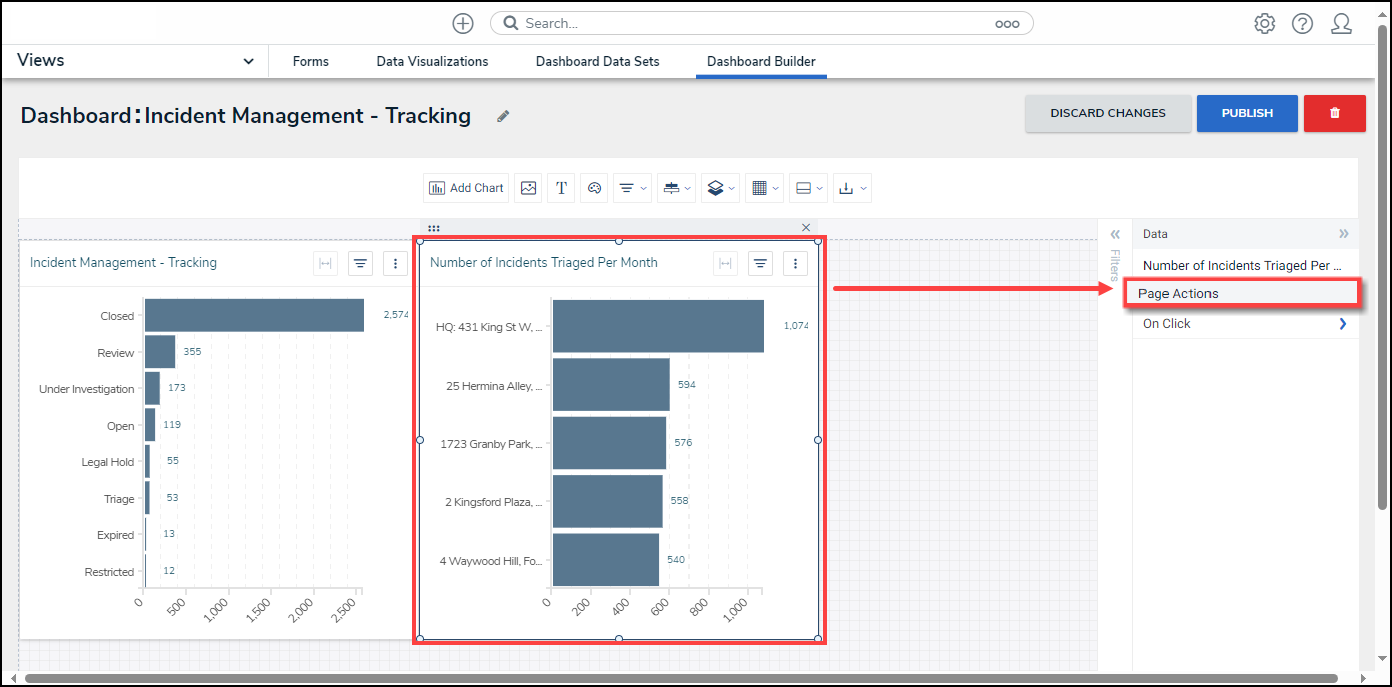
Page Action
Setting Dashboard Page Actions (Drill Downs)
- From the Data section, click the On Click link to expand Page Action options.
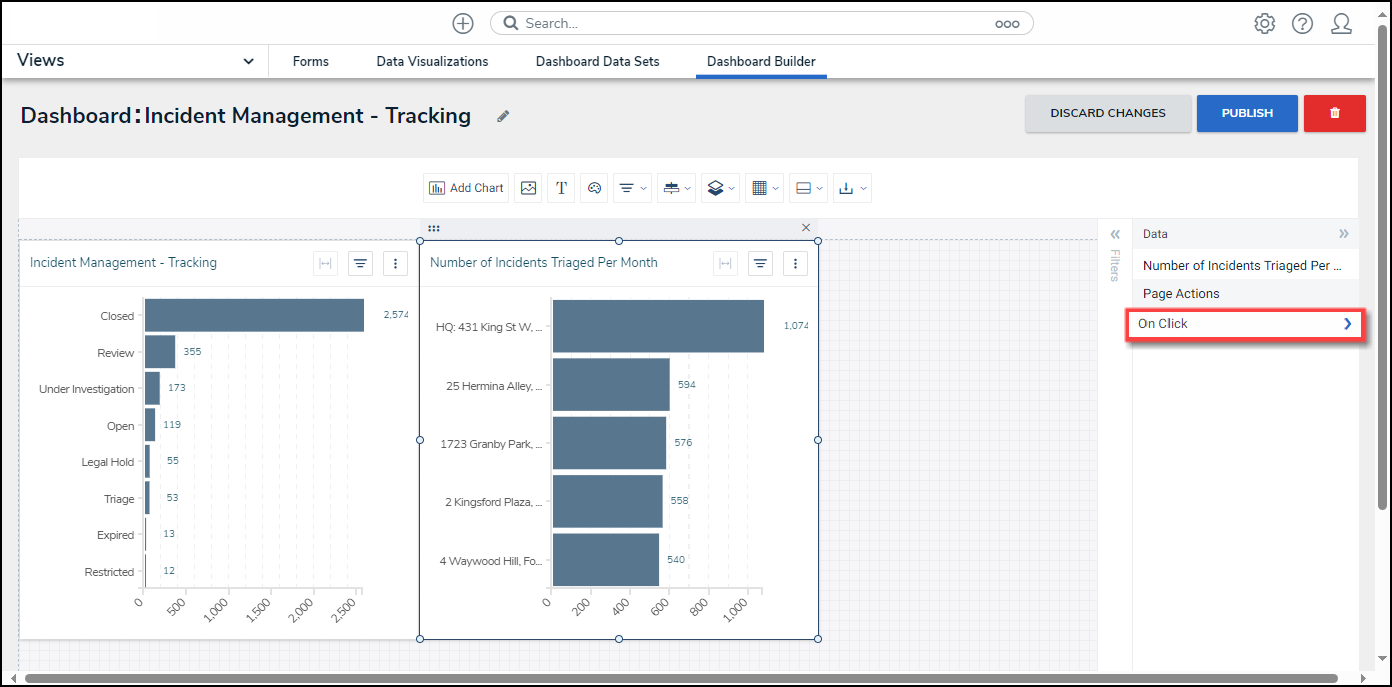
On Click Link
- From the Page Actions screen, select an On Click option from the dropdown list by selecting the corresponding radio button:
- Data Point: The Data Point option creates a Page Action trigger when a Data Point is selected from a Chart.
- Panel: The Panel option creates a Page Action trigger when the user clicks outside the Chart.

On Click Options
- Select a Filter By option from the dropdown list by selecting the corresponding radio button:
- Off: The Off option disables the Filter By option.
- Only Chart: The Only Chart option only applies the filter to the selected Chart.
- Full Page: The Full Page option applies the filter to all charts on the Canvas section on the Dashboard Builder screen, using the same Data Set.

Filter By Options
- The Filter By Option will appear on the Dashboard Builder and Dashboard Widget screens when a user clicks a Data Point on a Chart (Data Point) or clicks outside the Chart (Panel).

Filter By Option
- Select a Go to URL option from the dropdown list by selecting the corresponding radio button:
- Off: The Off option disables the Go to URL option.
- Go to URL: The Go to URL option allows users to set an external URL link to appear within the Canvas section on the Dashboard Builder screen.
- Title: The Title option allows users to enter a custom title for the URL. The Title will appear on the Dashboard Builder screen within the Menu options.
- URL: Enter a valid external URL.
- Open In: Select an open option from the Open In dropdown menu:
- Self: Opens the external URL on the current screen.
- New Tab: Opens a new browser tab to display the external URL.
- New Window: Opens a new browser window to display the external URL.

Go to URL Options
- The Go to URL will appear on the Dashboard Builder and Dashboard Widget screens when a user clicks a Data Point on a Chart (Data Point) or clicks outside the Chart (Panel).

Go to URL
- Select a Chart Drill Down option from the dropdown list by selecting the corresponding radio button:
- Off: The Off option disables the Chart Drill Down option.
- Default: The Default option allows a user to create Chart Drill Downs using the data columns from the selected Chart.
- Select Columns to Display: Click the Checkbox next to a column to add it to the Chart as a drill down.
- Selected Columns: Click the X icon next to the column to remove the column from the Chart or deselect the Checkbox on the Select Columns to Display field to remove the column from the Chart.
- Custom: The Custom option allows users to create a Chart Drill Down using the data from the Charts that appear on the Canvas on the Dashboard Builder screen. Users can add multiple drill-down levels based on the number of Charts on the Dashboard Builder screen. Click the Plus icon to add a Chart as a drill-down, and click the Minus icon to remove the Chart.

Default Chart Drill Down
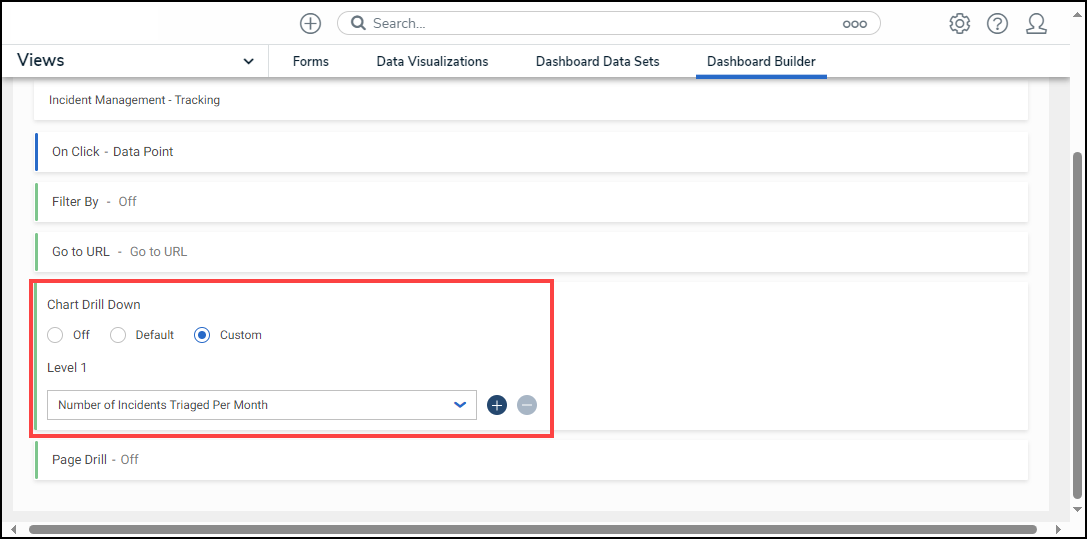
Custom Chart Drill Down
- Select a Page Drill option from the dropdown list by selecting the corresponding radio button:
- Off: The Off option disables the Page Drill option.
- Go to Page: The Go to Page option enables the Go to Page redirect that opens a new Dashboard when clicking a Data Point or outside of the Chart panel.
- Select Page: Select a Dashboard (page) redirect from the dropdown menu.
- Menu Label: Enter a custom Page Drill Title that will appear when clicking a Data Point or outside of the Chart panel.
- Apply Filters: The Apply Filters checkbox will filter the Chart(s) on the Dashboard selected from the Select Page dropdown menu based on the column(s) selected from the Select target columns to filter dropdown menu. The Select target columns to filter dropdown menu will be greyed out when the Apply Filters checkbox is not selected.
- Select target columns to filter: Select the column(s) that will filter the connected Dashboard. The Apply Filters checkbox must be selected to access the Select target columns to filter dropdown menu.

Page Drill Options
- After completing the Page Action configuration, click the < Back to Page link to save your changes and return to the Dashboard Builder screen.

< Back to Page Link
- From the Dashboard Builder screen, click the Publish button for the Page Actions to take effect.