This article and the next few articles of this guide provide instructions for creating basic reports. Should you need to create additional reports with more complex requirements (e.g., a report that displays which risks are or are not associated with a Risk Response Plan), please contact your CSM at customersuccess@resolver.com. Read more here: Reports and Report Elements.
To create a new data visualization:
- Click the
 icon in the top bar > Data Visualizations in the Views section.
 - Click Create Data Visualization.
- Enter Company - Risk Response Plan Tracker in the Name field.
- Ensure Report is selected in the Type dropdown menu.
- Select Company, Risk Response Plan from the Data Visualization Focus dropdown menu.
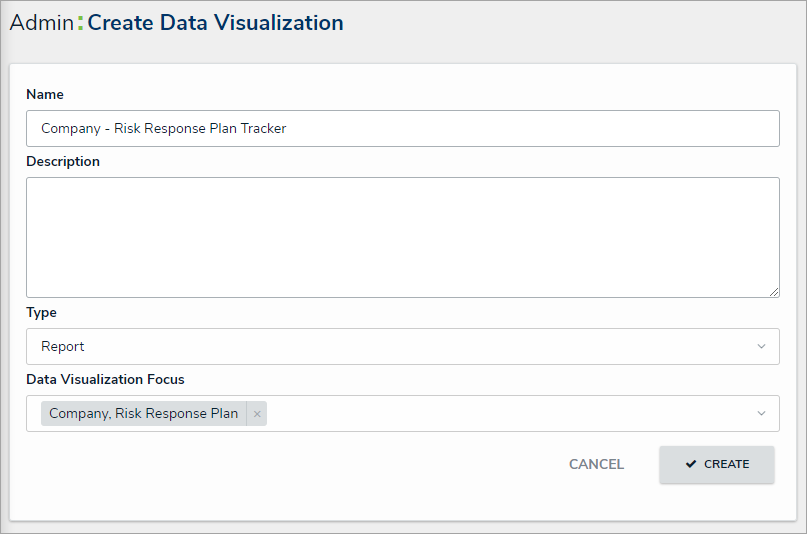 The Create Data Visualization page.
 - Click Create to display the Edit Report page.
 icon in the top bar > Data Visualizations in the Views section.
Add a table element to the report:
- From the Edit Report page for Company - Risk Response Plan Tracker, expand Display from the Elements menu to the left of the Report Canvas.
- Drag and drop the Table element to the Report Canvas.
- Select Risk Response Plans from the Select a data series dropdown menu, then click Done to display the Edit Table palette.
- From the Data Type tab, deselect the Select All checkbox.
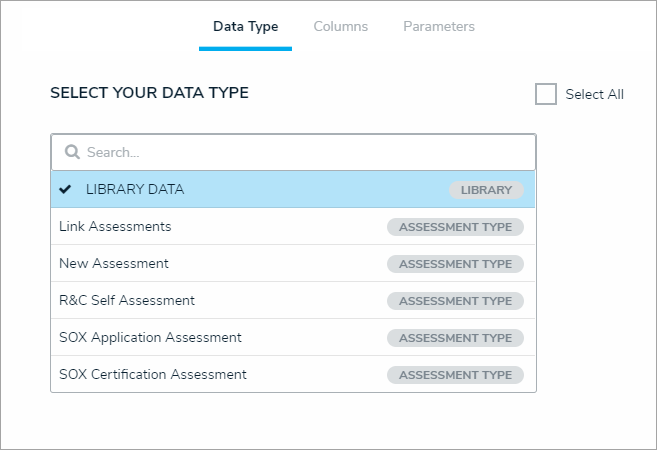 The Data Type tab in the Edit Table palette.
 - Click the Columns tab, then click to select the following in the Select Data section:
- Name (Property)
- Unique ID (Property)
- Plan Owner (Role)
- Date of Last Review (Date & Time)
- Date of Next Review (Date & Time)
- Risks (Relationship)
- Risk Response Plan (State)
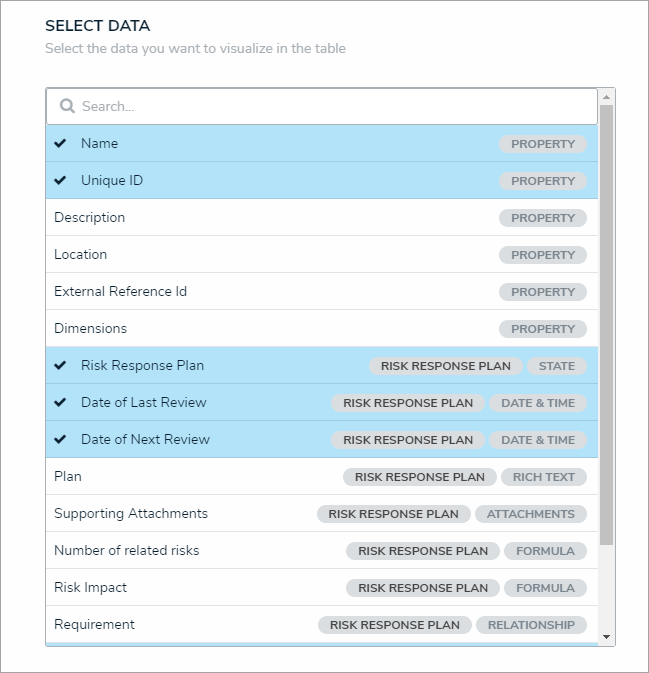 The Select Data section.
- Scroll to the bottom of the palette, then select the Display colored cells as ovals checkbox.
- Click Done when finished.


To add a pie chart element to the report:
- From the Edit Report page for Company - Risk Response Plan Tracker, expand Display from the Elements menu to the left of the Report Canvas.
- Drag and drop the Pie Chart element to the Report Canvas.
- Select Risk Response Plans from the Select a data series dropdown menu, then click Done to display the Edit Pie Chart palette.
- From the Data Type tab, deselect the Select All checkbox.
- Click the Configure Your Chart tab.
- Select Risk Response Plan (State) from the Select Data section.
- Enter Plan Status in the Chart Title field.
- Ensure Pie is selected in the Display Type.
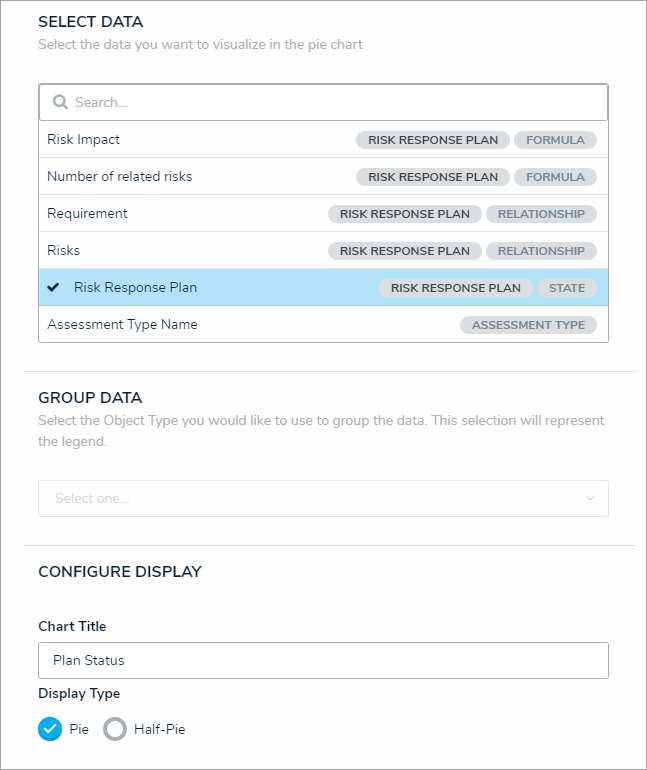 The Edit Pie Chart palette.
 - Click your browser's back button to return to the Form Canvas.
- Drag the pie chart to move it above the table element.

To add filters to the report:
- From the Edit Report page for Company - Risk Response Plan Tracker, click Configure Filters.
- Select the following from the Select Filters section:
- Plan Owner (Role)
- Date of Last Review (Date & Time)
- Date of Next Review (Date & Time)
- Risk Response Plan: Workflow State
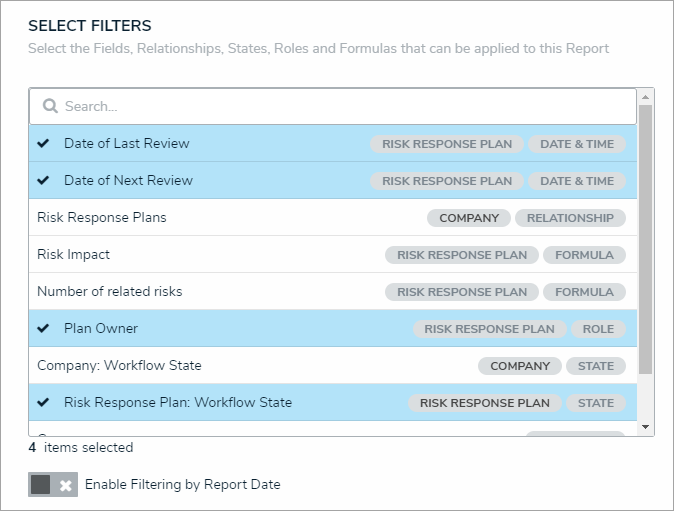 The Select Filters section of the Configure Filters palette.
- Click the X in the top-right corner of the palette when finished.

| << Previous |