Overview
The Column Shelf shows which Categories and Values are in use within the Chart. The Column Shelf also allows the user to edit and format the way the Categories and Values function within the Chart. The number of Categories and Values that can appear in the Column Shelf depends on the Chart Type.
Editing and Formatting options for the Categories and Values also depend on the Data Type (Text, Numeric, Data).
 Warning:
All changes or edits made to a Chart are globally applied across all instances of that Chart. Create a duplicate Chart to apply changes or edits that will not affect the original Chart.
User Account Requirements
The user account you use to log into Resolver must have Administrator permission or Data Management advanced permissions to edit/format a Category or Value.
Related Information/Setup
To create a new Dashboard Data Set, please follow the link below:
After creating a Dashboard Data Set, the user must publish it before it can be used with the Dashboard Data Set Builder. Please follow the link below for more information on Publishing a Dashboard Data Set.
Navigation
- From the Home screen, click the Administration icon.
![]()
Administration Icon
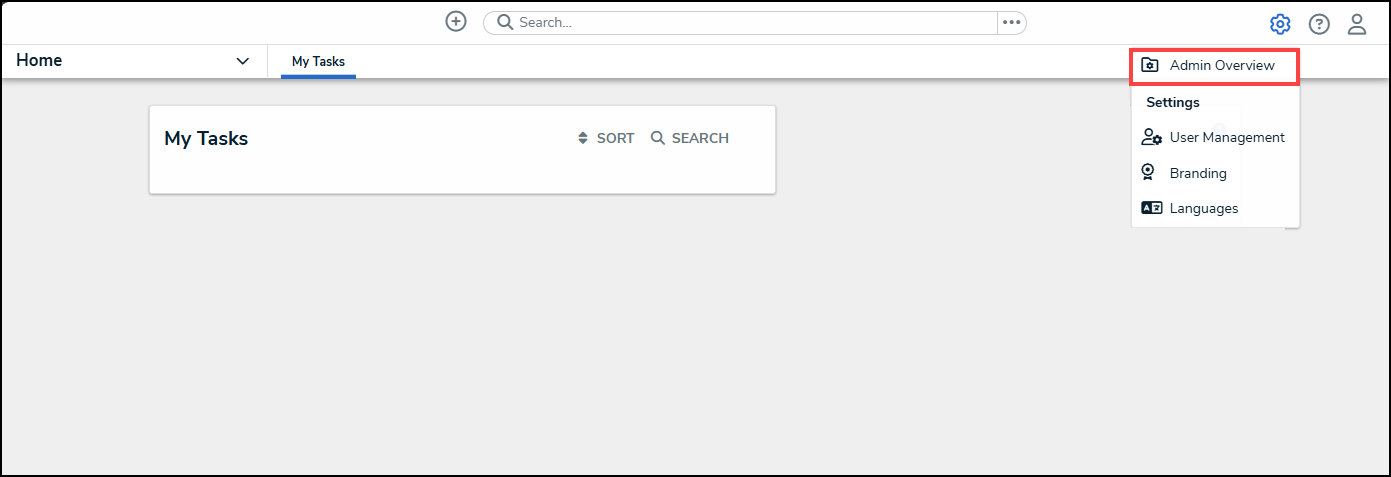
- From the Administrator Settings menu, click the Admin Overview link.
Administrator Settings Menu
- From the Admin Overview screen, click on the Dashboard Builder tile under the Views section.

Dashboard Builder Tile
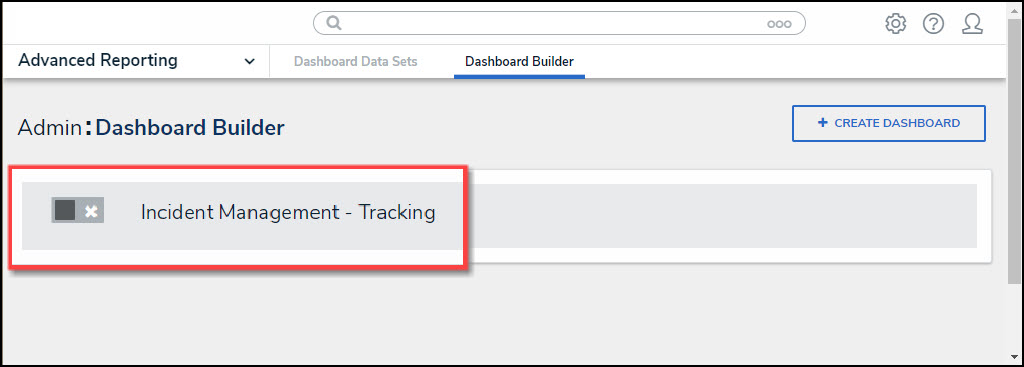
- From the Dashboard Builder screen, click on a Dashboard Name.
Dashboard Name
Editing/Formatting a Category or Value
- From the Dashboard screen, click on the More Options icon on an existing ChartView.
![]()
More Options Icon
- Select the Edit option from the More Options dropdown menu.

Edit Option
- From the Chart screen, the Category and Value fields contain the following elements:
- Drag Icon
- Data Type Icon
- Dashboard Data Set Field Name
- Aggregation
- Sorting Icon
- More Options Icon
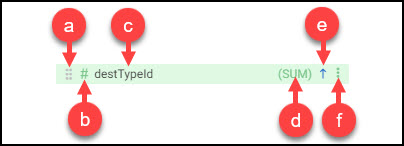
Category and Value Field Breakdown
- Click the More Options icon in the Category field at the top of the Chart.

More Options Icon
- The More Options icon gives the user more control over how the Category and Value functions:
- Category
- Text, Numeric, and Date Values:
- Sort Ascending: Sort the data values in an Ascending Order (first-to-last or smallest-to-largest).
- Sort Descending: Sort the data values in a Descending Order (last-to-first or largest-to-smallest).
- Numeric and Date Values:
- Discrete: The Discrete option returns a finite amount of data. There is an end to the amount of data returned.
- Continuous: The Continuous option returns an infinite amount of date. The amount of data returned is continuous.
- Date Values Only:
- Date Group: The Date Group allows you to change how the Date Data is displayed (e.g., Year, Month, Day, Quarter, etc.).
- Data Format: If Full Date is selected for the Data Group, the Date Format option will appear, allowing you to adjust the DD/MM/YY format.
- Remove: Deletes the Category from the Chart.
- Text, Numeric, and Date Values:

Category More Option Menu
- Value
- Text, Numeric, and Date Values:
- Sort Ascending: Sort the data values in an Ascending Order (first-to-last or smallest-to-largest).
- Sort Descending: Sort the data values in a Descending Order (last-to-first or largest-to-smallest).
- Aggregation: Aggregation types use arithmetic operations to obtain a single value that represents a larger set of values.
- Sum: The Sum type adds values together.
- Average: The Average type is a single value that represents a larger set of values, which is the sum of the numbers divided by the number of digits in the Data Set.
- Median: The Median type is the middle value of a Data Set.
- Count: The Count type finds the number of values in a finite Date Set.
- Distinct Count: The Distinct Count finds specific values within a Data Set.
- Minimum: The Minimum type determines the smallest number in the Data Set.
- Maximum: The Maximum type determines the largest number in the Data Set.
- Values Format: The Values Format allows you to change how the value data appears on the Chart (e.g., Decimal, Currency, Percentage, etc.).
- Numeric Values Only:
- Table Calculations: The Table Calculations feature produces new columns of data based on predefined aggregate functions executed against existing columns of data. Any data column added to the Values or Other Values shelves in the Chart Builder UI can be used as a source column for a table calculation.
- Running Sum (RSUM): The Running Sum calculates the new sum total value of the current row by adding the value in the source column of the current row to the computed sum total from the previous row.
- Running Average (RAVG): The Running Average calculates the new average for the current row by referencing the value in the source column of the current row and computing the new average based on the average from the previous row.
- Running Minimum (RMIN): The Running Minimum references the value in the current row from the source data column and compares it to the previous minimum value. If the value in the source column is less than the previously computed minimum value, the new running minimum value is updated with the new lower value.
- Running Maximum (RMAX): The Running Maximum references the value in the current row from the source data column and compares it to the previous maximum value. If the value in the source column exceeds the previously computed maximum value, the new running maximum value is updated with the new higher value.
- Difference: The Difference is a row-by-row type of calculation that generates the difference between two values (the current value subtracted from the previous value) of an aggregated column. The calculation is recalculated every time that an event is applied to the Chart, such as sorting, filtering, new records added, groups edited/removed/added, or when max data points are applied.
- Percent Difference: The Percent Difference is a row-by-row calculation based on the following formula [Percent Difference = (value - previous value) x 100 / previous value]. The calculation is performed on a table-down basis, i.e. all values in the column are consistently compared to the same value in the previous row throughout the entire table. The calculation is recalculated every time that an event is applied to the Chart, such as sorting, filtering, new records being added, groups being edited/removed/added, or when max data points are applied.
- Table Calculations: The Table Calculations feature produces new columns of data based on predefined aggregate functions executed against existing columns of data. Any data column added to the Values or Other Values shelves in the Chart Builder UI can be used as a source column for a table calculation.
- Remove: Deletes the Value from the Chart.
- Text, Numeric, and Date Values:

Value More Options Menu