Overview
Table Calculations allows users to create new columns of data based on predefined aggregate functions (e.g., Running Average, Running Sum, Running Min, etc.) using Column Data from the Columns loaded in the Columns field.
User Account Requirements
The user account you use to log into Resolver must have Administrator permission or Data Management advanced permissions to add a Table Calculation.
Related Information/Setup
Please see the corresponding article below for Information on Adding a Table/Group Table to a Dashboard.
Navigation
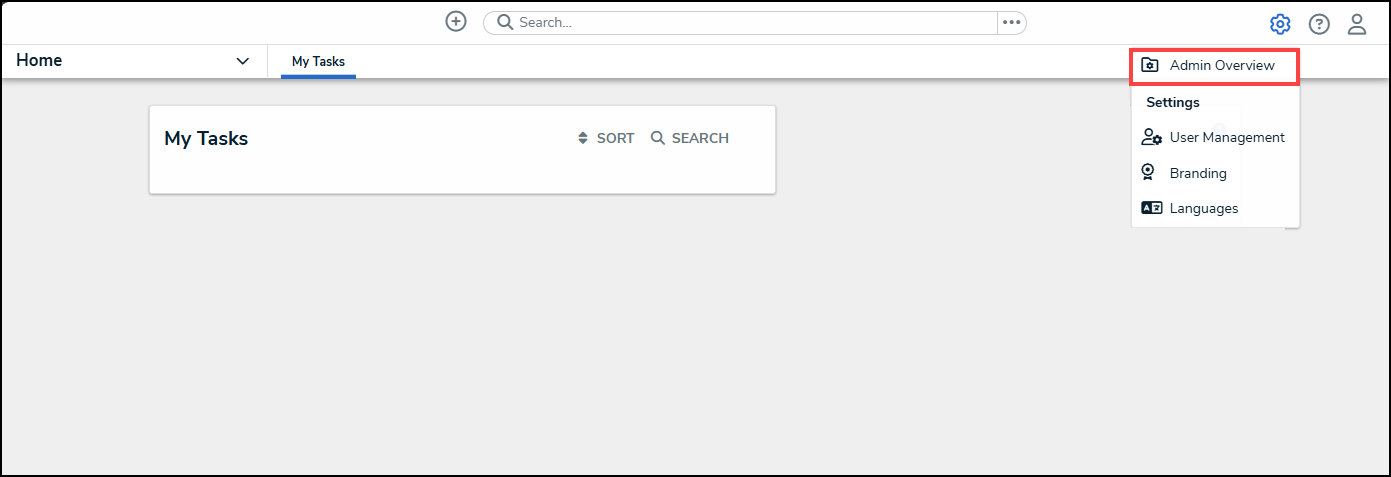
- From the Home screen, click the Administration icon.
![]()
Administration Icon
- From the Administrator Settings menu, click the Admin Overview link.
Administrator Settings Menu
- From the Admin Overview screen, click on the Dashboard Builder tile under the Views section.

Dashboard Builder Tile
- From the Dashboard Builder screen, click on a Dashboard Name.
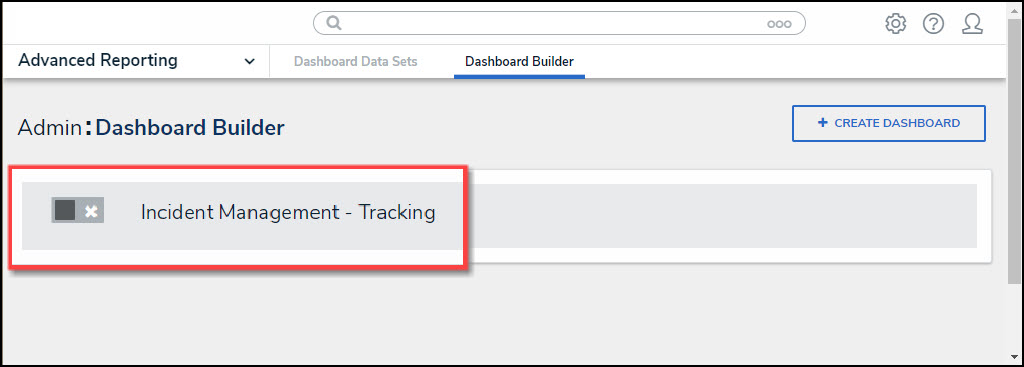
Dashboard Name
Adding Multi-Column Sort to a Table
- From the Dashboard screen, find an existing Group Table on the Dashboard.

Group Table View
- Click the More Options icon on the Group Table View and select Edit from the dropdown menu.

Edit
- From the Chart screen, select the General panel from the Configuration panel.

General Panel
- Click the Table Calculations panel.
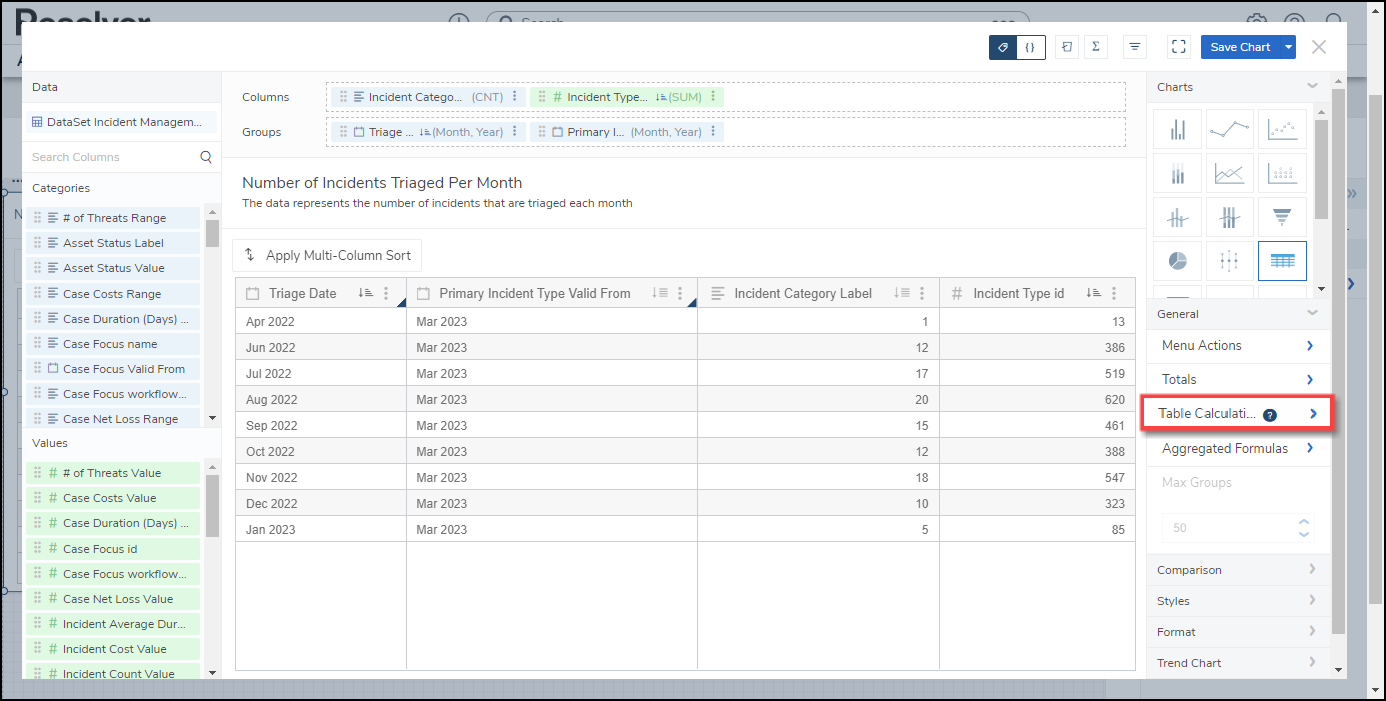
Table Calculations Panel
- Click the +Add Table Calculations link.

+Add Table Calculations Link
- Click the Table Calculations 1 panel.

Table Calculations 1 Panel
- Select a Column to create the new Table Calculation Column from the Columns dropdown menu. Only Categories and Values in the Columns field will appear in the dropdown menu.

Columns Dropdown Menu
- Select a Calculation Type to create the Table Calculation Column from the Calculation Type dropdown menu.

Calculation Type Dropdown
- Running Average (RAVG): The Running Average type calculates a new average by dividing the first row's value in the source column (Column dropdown menu) by the numb0er of row values (1). To calculate the next value, you would add the first two row values from the source column, divide by the number of row values (2), and so on.
- Running Sum (RSUM): The Running Sum type calculates a new sum value by adding the value in the source column (Column dropdown menu) to the value from the previous rows in the source Column.
- Running Min (RMIN): The Running Minimum type compares the value in the current row in the source column (Column dropdown menu) to the previous minimum value. If the value in the source column is less than the previously computed minimum value, then the new running minimum value is updated with the lower value.
- Running Max (RMAX): The Running Maximum type compares the value in the current row from the source column (Column dropdown menu) to the previous maximum value. If the value in the source column exceeds the previously computed maximum value, the new running maximum value is updated with the higher value.
- Difference: The Difference type is a row-by-row type of calculation that compares the difference between two values (the current value subtracted from the previous value) of an aggregated column. The calculation is recalculated every time an event is applied to the chart, such as sorting, filtering, new records added, groups edited/removed/added, or when max data points are applied.
- % Difference: The Percent Difference type is a row-by-row calculation. The calculation is performed on a table-down basis. All values in the column are consistently compared to the same value in the previous row throughout the entire Table. The calculation is recalculated every time that an event is applied to the chart (e.g., Sorting, Filtering, New Records, Groups edited/removed/added, and Max Data points applied). The calculation is based on the following formula:
- Percent Difference = (value - previous value) x 100 / previous value
- Select a Level from the Level dropdown menu. The Level dropdown appears when more than one group is loaded in the Group field. The Level dropdown allows users to select what level the Table Calculation is applied. Select Table to apply the Table Calculations to the whole table.

Level Dropdown Menu
- Enter a Customer Label for the Table Calculation in the Custom Label field. The Custom Labor will appear on the Configuration Panel instead of the default Table Calculation 1 label.
 Note:
Note:
The Custom Label field will save after you add a new label and click outside of the Custom Label field.

Custom Label
- (Optional) Click the Remove link to delete the Table Calculation from the Table.

Remove Link
- Click the Save Chart button to save your changes.