Overview
Users can create Tooltips that appear as a pop-up when they hover their cursor over a Chart data point. By default, the Tooltip pop-up displays the same data used to generate each data point in the Chart. If the data point value for a specific bar in a Chart is 100, then the Tooltip will display 100 as well. Users can customize the data values displayed in the Tooltip by adding one or more Tooltip columns that map to other fields in the selected dataset.
Tooltips will appear on all Chart Types, excluding Tables, Crosstab, and Expanded Tables.
User Account Requirements
The user account you use to log into Resolver must have Administrator permission to add Tooltips to a Chart.
Related Information/Setup
To create a new Dashboard Data Set, please follow the link below:
After creating a Dashboard Data Set, the user must publish it before it can be used with the Dashboard Data Set Builder. Please follow the link below for more information on Publishing a Dashboard Data Set.
Navigation
- From the Home screen, click the Administration icon.
![]()
Administration Icon
- From the Administrator Settings menu, click the Admin Overview link.
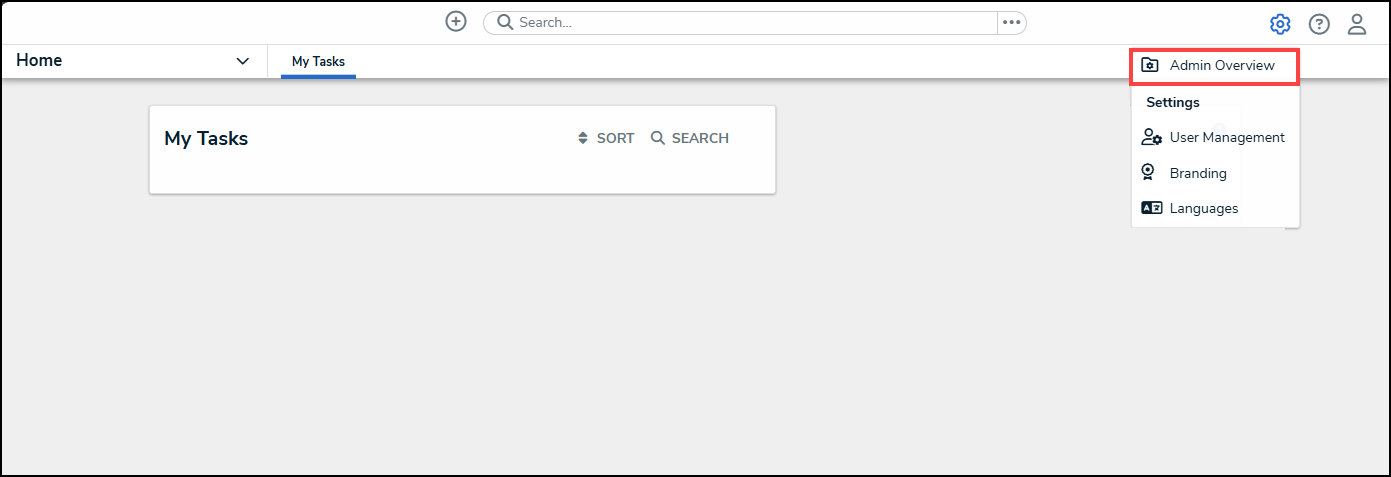
Administrator Settings Menu
- From the Admin Overview screen, click on the Dashboard Builder tile under the Views section.

Dashboard Builder Tile
- From the Dashboard Builder screen, click on a Dashboard Name.
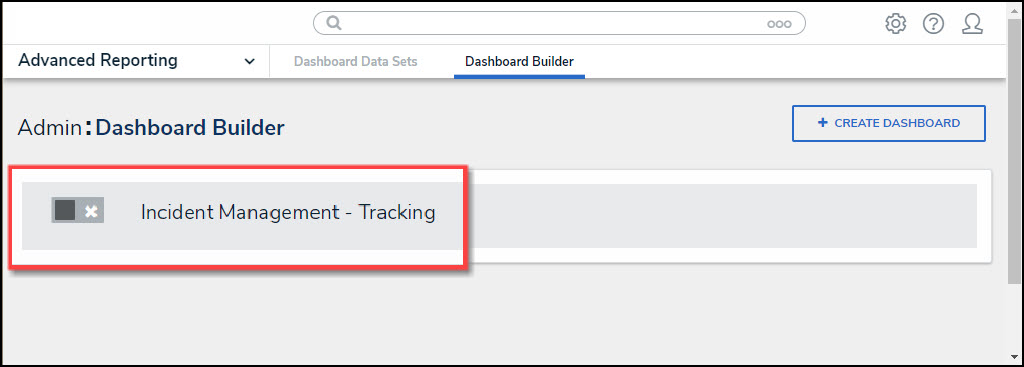
Dashboard Name
- From the Dashboard screen, to access the Chart screen, click on the Add Chart button.

Add Chart Button
- Or click on the More Options icon on an existing Chart View.

More Options Icon
- Select the Edit option from the More Options dropdown menu.

Edit Option
Adding Tooltips to a Chart
 Note:
Note:
The options available under the General Panel will differ depending on the Chart Type.
- From the Chart screen, click the General panel from the Configuration Panel.

General Panel
- From the General panel, click Tooltips to expand the options. By default, Tooltips will be enabled (checked).

Tooltips
- Click on the + Add Column link.
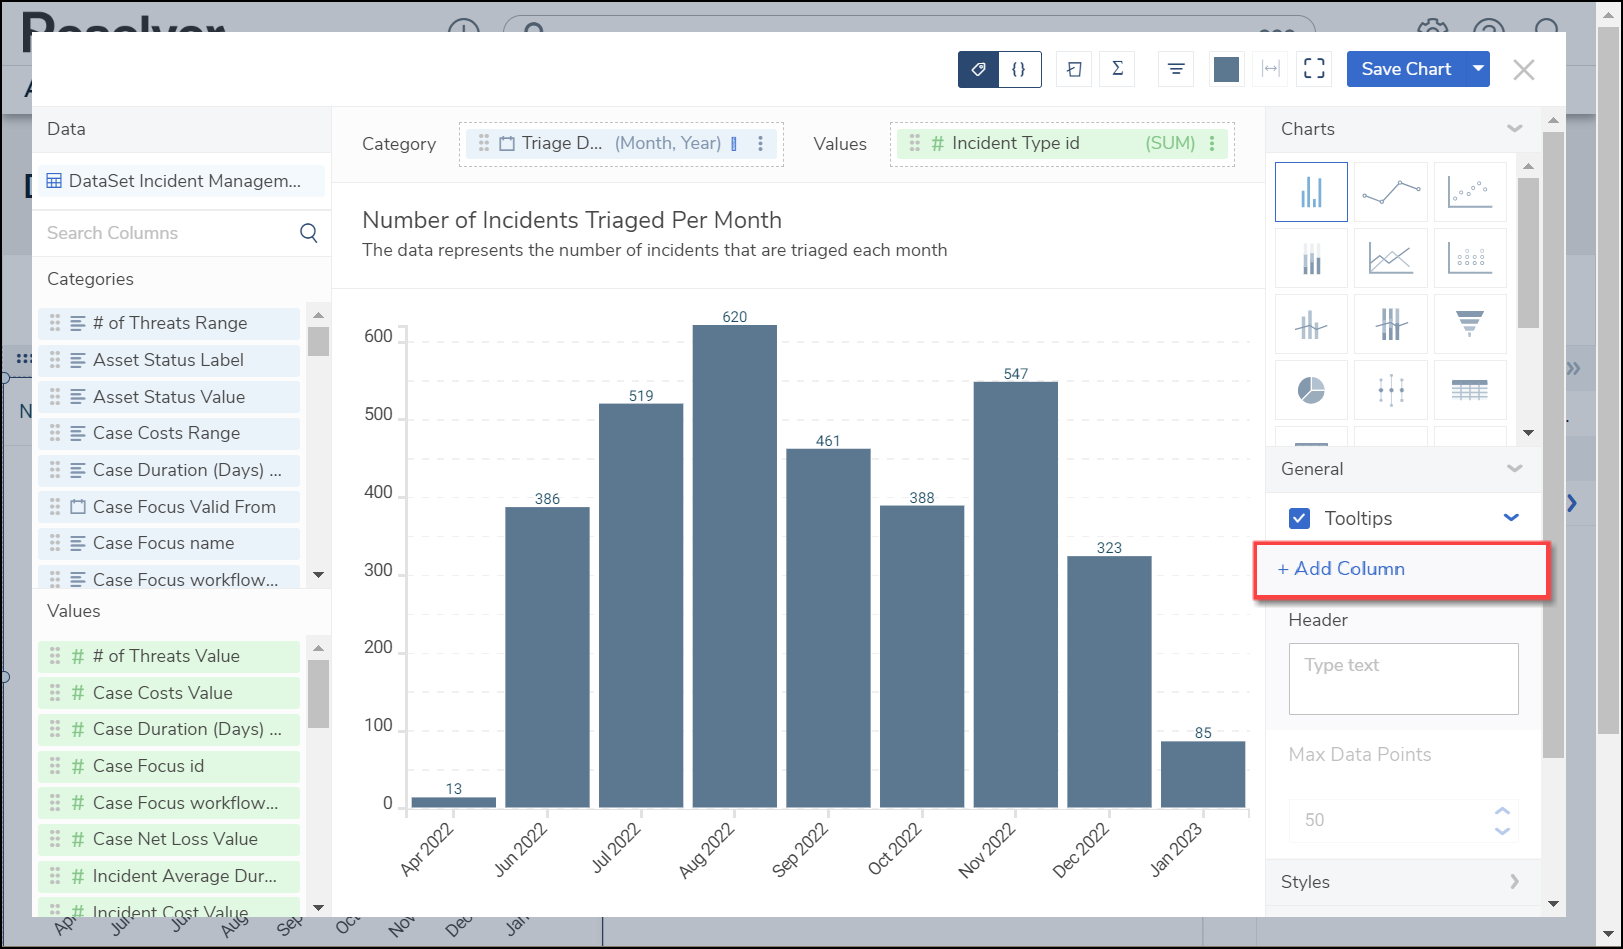
+ Add Column Link
- A new column named Column 1 will appear under the + Add Column panel. Click the Column 1 panel.

Column 1 Panel
- From the Column 1 Options panel, select a Data Column from the Column dropdown menu.
 Note:
Note:
When you select a Data Column from the Column dropdown menu, the Column 1 panel will use the Data Column Name instead of the default Column 1 naming convention.

Column Dropdown Menu
- Select a Display Value As option from the dropdown menu:

Display Value As Dropdown Menu
- Sum: The Sum type adds values together.
- Average: The Average type is a single value that represents a larger set of values, which is the sum of the numbers divided by the number of digits in the Data Set.
- Median: The Median type is the middle value of a Data Set.
- Count: The Count type finds the number of values in a finite Data Set.
- Distinct Count: The Distinct Count finds specific values within a Data Set.
- Minimum: The Minimum type determines the smallest number in the Data Set.
- Maximum: The Maximum type determines the largest number in the Data Set.
- Unique Value: The Unique Value type will show the first and last record in the Data Set for the selected Column.
- Select a Values Format by clicking on the corresponding Values Format button to apply it to the Data Column's data:
| Default: The Default Values Format will show the whole value. | |
| Abbreviated: The Abbreviated Values Format will abbreviate the value's unit of measure (e.g., k - kilo, M - million, etc.). | |
Decimals: The Decimals Values Format will include decimal places in the value. The number of decimal places can be set in the Decimal Place field by clicking the increase or decrease arrows.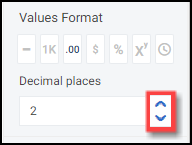 Decimal Place Field | |
Currency: The Currency Values Format will display the value as a currency (e.g., $1,234,567.89). You can select a currency type from the Currency dropdown menu. The number of decimal places can be set in the Decimal Place field by clicking the increase or decrease arrows.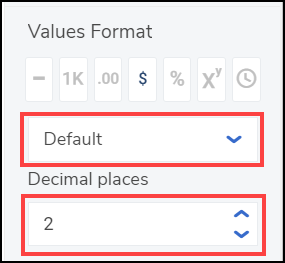 Currency and Decimal Fields | |
| Percentage: The Percentage Values Format will display the value as a percentage (e.g. 50%). | |
| Scientific: The Scientific Value Format will display the value as an exponential notation (e.g., 1e+6). | |
Duration: The Duration Value Format will display the value in date and time format (e.g., 1D, 12H, 59M, 25S). Users can select a Date and Time format from the Format dropdown menu.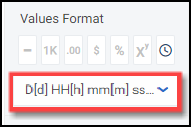 Format Field |
- (Optional) Click the Header field to enter a Tooltip Header Name.
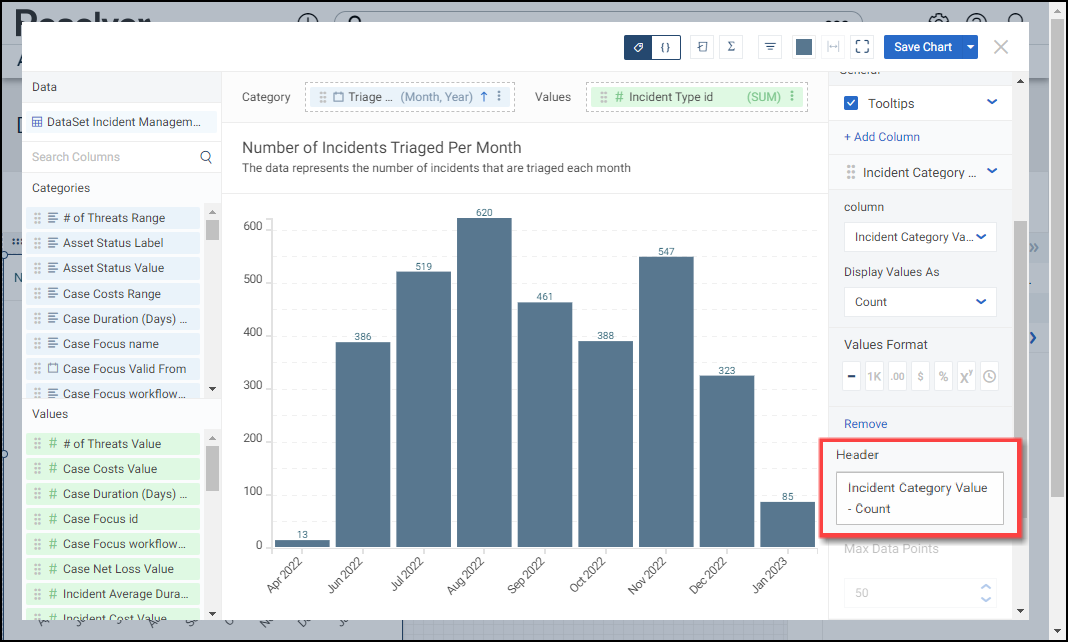
Header Field
- (Optional) The user can adjust the number of data points included on the Chart by using the increase and decrease arrows on the Max Data Point field or clicking the field and entering the number of data points you want to display. The Max Data Points is set to 50 by default. The maximum number of data points you can display on a Chart is 10,000. The more data point on a Chart, the longer it will take the Chart to render.

Max Data Points Field
 Note:
Note:
The Max Data Points field will be greyed out on Charts that use Date and Time Data values.
- Click the Remove link to delete the Tooltip from the Chart.

Remove Link
- Click the Save Chart button to save the Tooltip to the Chart.
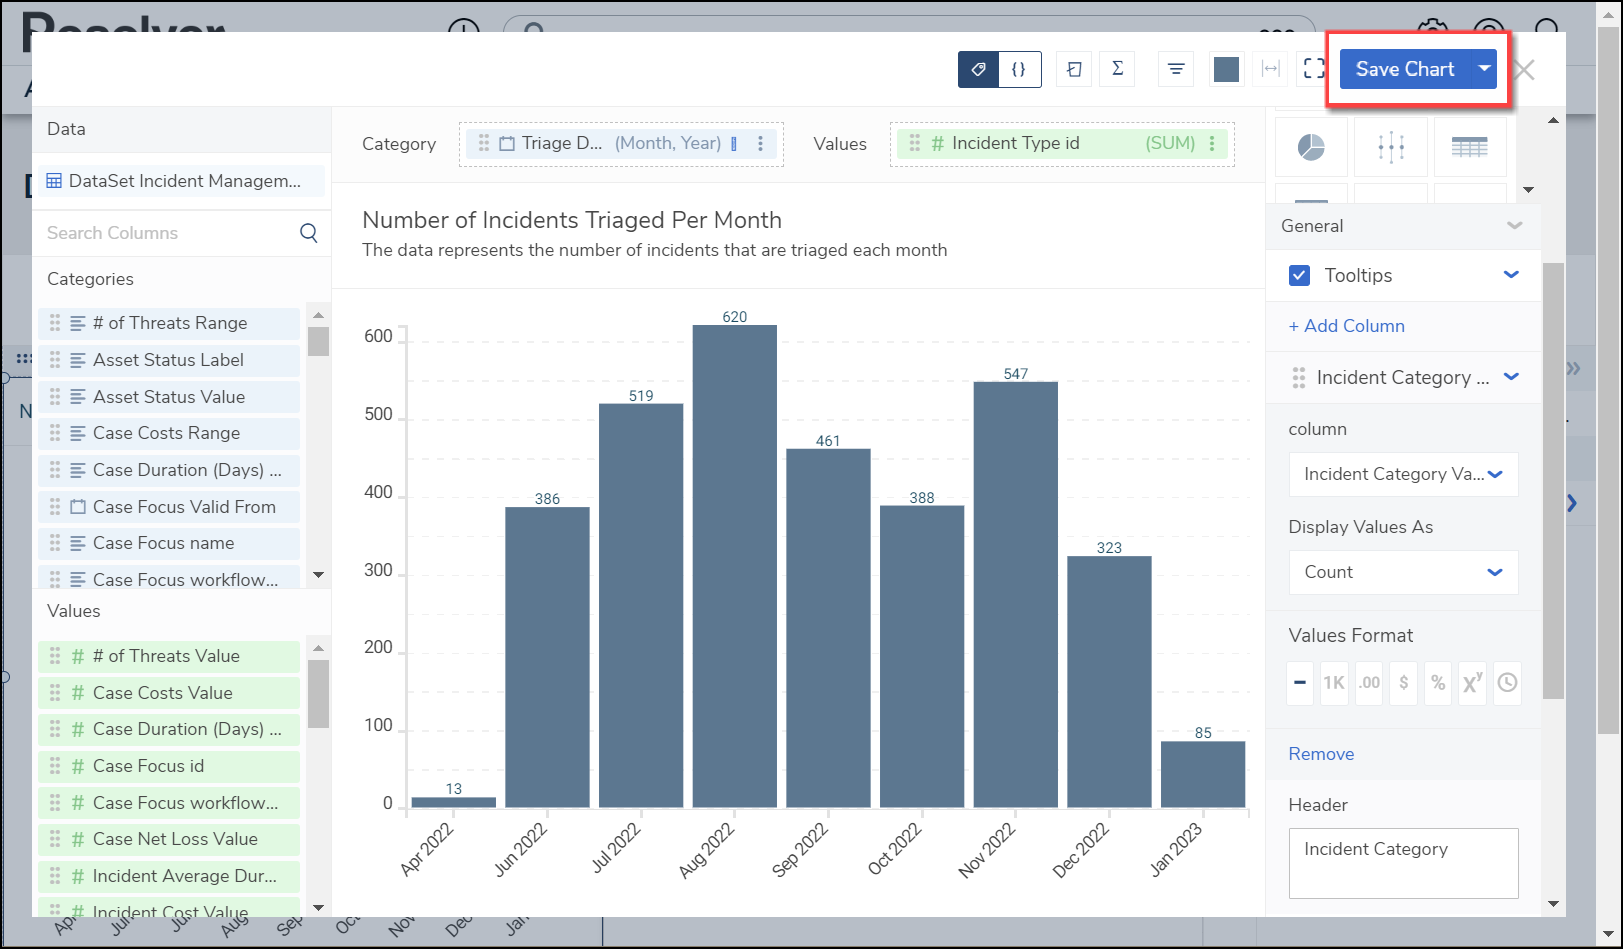
Save Chart Button
- The system will take you back to the Dashboard screen when you save the Chart. To apply further changes, click the More Options icon and select Edit from the More Options dropdown menu.
- When the Tooltip is added, it will appear when you hover your cursor over a data column on the chart.

Tooltip